


Using latrace
The latrace debugging tool is used for tracing the function calls across multiple libraries and collecting call statistics in a manner similar to strace. The latrace tool takes the path of the program to be traced as an argument, and traces it until it exits. The tool intercepts and records all the function calls from the program under debugging, which are defined in dynamic libraries, or any system calls invoked by it. It also traces all the signals which are received by the debugged process.
You can use the latrace tool to run a command, and trace and display its dynamic library calls using a LD_AUDIT Glibc feature. To generate the output only for the relevant part of the use case, you can toggle the trace output on and off. The latrace tool can also measure and display various statistics for library calls.
The latrace tool works in two modes:
- In the native mode the tool generates the output directly in the traced program process.
- In the pipe mode the tool sends the data from the traced process to the latrace process. The latrace process is then responsible for the output.
You must restart the process with latrace for the tracing to work.
Note: To measure and display statistics for system calls, use the strace tool.
Packages
source: latrace
binary: latrace
Installing latrace on the Harmattan device
Install latrace through the developer mode applet.
Prerequisite: Developer mode must be enabled.
- Select Settings > Security > Developer mode.
- Install the Tracing bundle package by clicking Install.
- You get a notification screen that lists all the applications to be installed in the bundle package. To install, click OK.
- A dependency notice appears. Click Accept.
For more information on developer mode and installable tools, see Activating developer mode.
Using the tool with the Instrumentation Dashboard
Instrumentation Dashboard is an extension to Qt Creator that provides data gathering and visualisation features.
Precondition:
Instrumentation Dashboard has been installed and connected to the Harmattan device. For instructions, see Using Instrumentation Dashboard.
The latrace UI provides a possibility to execute the latrace tool in two different modes:
- Statistics Mode
- Periodic View Mode
Statistics Mode
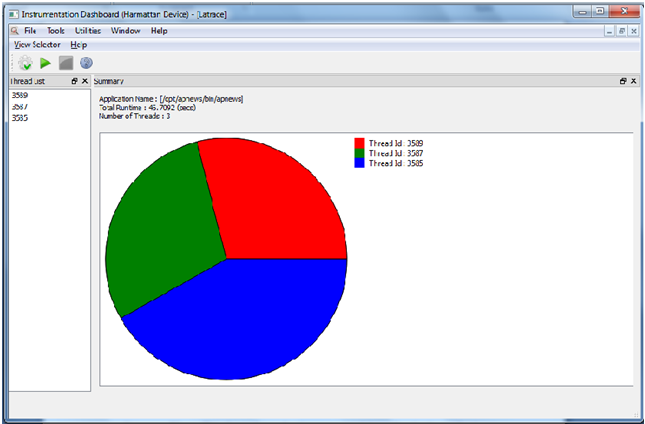
Statistics Mode gives statistical data of the application executing under latrace. The result is displayed in three views:
- Thread List View: Shows all the thread IDs, which are executed during the process execution. By double-clicking the thread IDs, you can see the statistics of different symbols present in that thread.
- Summary View: This shows the application name, total time taken by the application to execute, total number spawned by the application. Shows a pie chart showing the percentage of time taken by different threads.
- Thread View: This shows the statistical information of a thread. The view provides the following infor-mation:
- Total time spent for symbol is represented first column (sec:usec)
- Percentage of time spent in symbol
- Time taken for symbol per call (usec/call)
- Number of calls made to symbol
- Symbol name
- Library name
To launch latrace in the Statistics Mode, follow these steps:
- Click Tools in the Instrumentation Dashboard top menu bar and select latrace.
- Click Select Target App button
 in the tool bar. The Target Application Selector window opens.
-
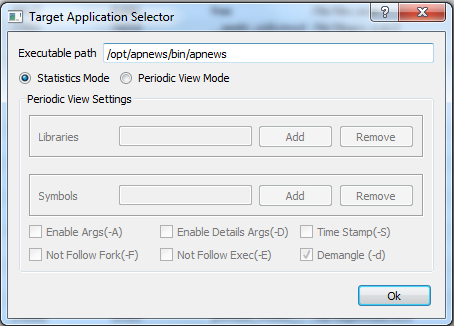 Target Application Selector window
-
- Enter the executable path, for example /opt/apnews/bin/apnews.
- Select Statistics Mode radio button and click OK.
- Click Start button
 in the tool bar. This launches the AP News application on the device.
Now latrace starts to collect the statistics of the application. Statistics are displayed in the Instrumentation Dashboard window once you have killed the launched application, clicked Stop button ![]() or when the application execution completes on the device.
or when the application execution completes on the device.
Periodic View Mode
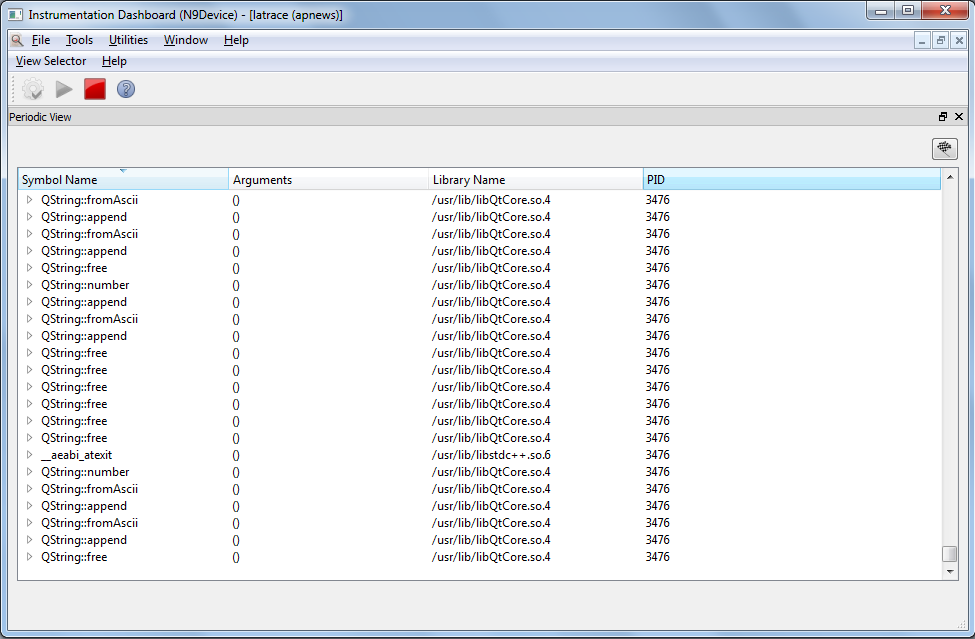
Periodic View Mode gives details of the following:
- The symbols (function names).
- The argument passed during invocation.
- The library containing the symbols.
- The time stamp and the return value of the function execution.
All the information displayed is dependent on the option selected in the Settings in Select Target App window when executing latrace. The following options are available:
- Enable Args: This enables argument output. (definitions from /etc/latrace.conf)
- Enable Details Arg: Display struct arguments in more detail.
- Time Stamp: Display time stamp for each symbol.
- Not Follow Fork: Do not follow fork calls for child processes.
- Not Follow Exec: Do not follow exec calls.
- Demangle: C++ demangle symbols on the output.
- Libraries: Specify (calls) from and (calls) to lib1, lib2, ...
- Symbols: Track specific function call. sym_name1, sym_name2, ...
To launch latrace in the Periodic View Mode, follow these steps:
- Click Tools in the Instrumentation Dashboard top menu bar and select latrace.
- Click Select Target App button in the tool bar. The Target Application Selector window opens.
- Enter the executable path, for example /opt/apnews/bin/apnews.
- Select Periodic View Mode radio button.
- Add libraries and symbols under the respective sections.
-
- Libraries: Specify (calls) from and (calls) to, for example lib1, lib2
- Symbols: Track a specific function call, for example sym_name1, sym_name2
-
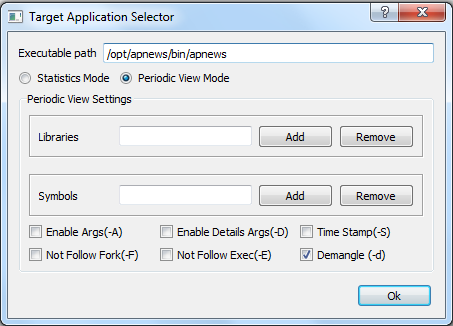 Periodic View Mode
-
- Click Start button in the tool bar. This launches the AP News application on the device.
Now latrace starts to collect data and it is displayed in the Instrumentation Dashboard window.
The following table presents the button elements in the example figure.
| Element in the example figure | Description |
|---|---|
|
|
Opens the Target Application Selector window. The button is disabled if an application is running. |
|
|
Start button starts the collecting of profiling data from the target application. The data is displayed in the Thread list and Summary views after the application is closed or killed. The button is disabled until a target application is selected or when an application is already running. |
|
|
Stop button stops the collecting of data at any point of time. |
|
|
Save button saves the periodic view data. |
|
|
Help button launches the tool help. |
Using the tool on the Harmattan device
For a comprehensive list of the available commands, see the manual reference pages for this tool.
Note: To use this tool with the developer account, run the latrace tool with the aegis-exec command. For example:
aegis-exec -u user latrace cat
Viewing basic output
To run latrace, enter the following command:
latrace cat
To start latrace with its output disabled, enter the following command:
latrace -q cat
The following output is displayed:
controled config: /tmp/lt-config-o1COBd/config
To enable the latrace output again, give the pipe name to latrace-ctl. Enter the following command:
latrace-ctl -d 0 /tmp/lt-config-o1COBd/config
To see the argument values specified by the default config file, enter the following command:
latrace -A cat
The following output is displayed:
23843     __libc_start_main(main = 0xe708, argc = 1, ubp_av = 0xbecb6cc4, auxvec = 0x5e2f0, init = 0x5e2ec, fini = 0x4000e5dc, rtld_fini = 0xbecb6cc4) [/lib/libc.so.6] {
23843       __sigsetjmp [/lib/libc.so.6]
23843       mallopt [/lib/libc.so.6]
23843       mallopt [/lib/libc.so.6]
23843       __errno_location [/lib/libc.so.6]
23843       strrchr(s = "cat", c = 47) [/lib/libc.so.6] {
23843       } strrchr = NULL
23843       getuid [/lib/libc.so.6]
23843       } getuid = 0
23843       bsearch(key = 0xbecb6dcd, base = 0x5f868, nmemb = 153, size = 1, compar = 0xe284) [/lib/libc.so.6] {
23843         strcmp(s1 = "cat", s2 = "mv") [/lib/libc.so.6] {
23843         } strcmp = -10
23843         strcmp(s1 = "cat", s2 = "fsync") [/lib/libc.so.6] {
23843         } strcmp = -3
23843         strcmp(s1 = "cat", s2 = "date") [/lib/libc.so.6] {
23843         } strcmp = -1
23843         strcmp(s1 = "cat", s2 = "chown") [/lib/libc.so.6] {
23843         } strcmp = -7
23843         strcmp(s1 = "cat", s2 = "awk") [/lib/libc.so.6] {
23843         } strcmp = 2
23843         strcmp(s1 = "cat", s2 = "chgrp") [/lib/libc.so.6] {
23843         } strcmp = -7
23843         strcmp(s1 = "cat", s2 = "cat") [/lib/libc.so.6] {
23843         } strcmp = 0
23843       } bsearch = 0x5f86e
23843       memset(s = 0xbecb62bc, c = 0, n = 1056) [/lib/libc.so.6] {
23843       } memset = 0xbecb62bc
23843       getopt_long(argc = 1, argv = 0xbecb6cc4, shortopts = "u", longopts = 0x5f530, longind = NULL) [/lib/libc.so.6] {
23843       } getopt_long = -1
23843       read(fd = 0, buf = 0xbecb56d8, nbytes = 4096) [/lib/libc.so.6] {
To start latrace in the pipe mode to get all the end symbols printed, enter the following command:
latrace -Ap cat
To see the argument values specified by the configuration file, enter the following command:
latrace -a latrace.conf cat
Viewing detailed output
To display output only for a specified symbol (such as read and write), enter the following command:
latrace -A -s read,write cat
To display flow for the specified symbol (such as sysconf), enter the following command:
latrace -b sysconf kill
To display output only for the specified library (such as libproc), enter the following command:
latrace -Al libproc w
To display symbol statistics, enter the following command:
latrace -c ls
To display symbol statistics sorted by time, enter the following command:
latrace -C time ls
The following output is displayed:
--------------------------------------------------------------------------
Statistics for [ls] total runtime: 0.110657 sec

Thread 23850 (runtime 0.101319 sec)
sec usec           +%  usec/call      calls symbol
--- ------ ---------- ---------- ---------- ------------------------------
 40:001069  32.241211     634937         63 strcmp@/lib/libc.so.6
 20:003359  16.122885     339039         59 malloc@/lib/libc.so.6
 19:003446  15.316945     327645         58 free@/lib/libc.so.6
 15:001741  12.091536     483927         31 readdir64@/lib/libc.so.6
  8:001131   6.448982     444507         18 __lxstat64@/lib/libc.so.6
  7:001127   5.642970     368480         19 strrchr@/lib/libc.so.6
  7:000946   5.642824     388941         18 strlen@/lib/libc.so.6
  6:001098   4.836938     315847         19 memcpy@/lib/libc.so.6
  1:001920   0.807556      55662         18 fputs@/lib/libc.so.6
  1:000428   0.806354     200085          5 memset@/lib/libc.so.6
  0:033144   0.026714       3682          9 putchar@/lib/libc.so.6
  0:006562   0.005289        364         18 vasprintf@/lib/libc.so.6
  0:006227   0.005019        691          9 fflush@/lib/libc.so.6
  0:001525   0.001229        762          2 qsort@/lib/libc.so.6
  0:001343   0.001082       1343          1 bsearch@/lib/libc.so.6
  0:001099   0.000886        122          9 printf@/lib/libc.so.6
  0:000366   0.000295        366          1 opendir@/lib/libc.so.6
  0:000275   0.000222        137          2 getenv@/lib/libc.so.6
  0:000244   0.000197        122          2 mallopt@/lib/libc.so.6
  0:000123   0.000099        123          1 time@/lib/libc.so.6
  0:000122   0.000098        122          1 __sigsetjmp@/lib/libc.so.6
  0:000122   0.000098        122          1 getuid@/lib/libc.so.6
  0:000122   0.000098        122          1 ioctl@/lib/libc.so.6
  0:000122   0.000098        122          1 getopt_long@/lib/libc.so.6
  0:000122   0.000098        122          1 isatty@/lib/libc.so.6
  0:000122   0.000098        122          1 __xstat64@/lib/libc.so.6
  0:000091   0.000073         91          1 __errno_location@/lib/libc.so.6
  0:000091   0.000073         91          1 strstr@/lib/libc.so.6
  0:000031   0.000025         31          1 closedir@/lib/libc.so.6
  0:000000   0.000000          0          1 __libc_start_main@/lib/libc.so.6
  0:000000   0.000000          0          1 exit@/lib/libc.so.6
Modifying the output
To store output in a text file, enter the following command:
latrace -o output.latrace ls
To change the libkrava1.so dependency to the libkrava2.so, enter one of the following commands:
 latrace -L krava1%krava2 ex
 latrace -L krava1~libkrava2.so ex
 latrace -L libkrava1.so=libkrava2.so ex
For C++ programs, use also the -d option to demangle the symbols.
Known issues
- The latrace tool does not currently have any mechanism for handling stack mangling by the setjmp/longjmp calls. Thus, the tool can cause an application to crash. As a workaround, tell latrace to ignore the Glibc setjmp call with the -n option. Enter the following command:
latrace -n _setjmp my-application
- Catching calls to or from a specific library with -l, -t, or -f does not work quite as expected due to the LD_AUDIT feature limitations. To catch all calls, for example, from libmeegotouchcore to libQtCore, you must give both libraries. Enter the following command:
latrace -d -l /usr/lib/libQtCore.so.4,/usr/lib/libmeegotouchcore.so.0 /usr/bin/widgetsgallery
- The -s option for catching individual functions and methods requires a mangled name for C++ methods. Enter the following command:
 $ latrace -d -s _ZN7QObject11deleteLaterEv /usr/bin/widgetsgallery
 3939     QObject::deleteLater [/usr/lib/libQtCore.so.4]
- The latrace tool is picky about the given library name. For example, to get the correct output for the QtCore library, use readelf. Enter the following command:
readelf -d /usr/bin/widgetsgallery|grep libQtCore
- Output example:
0x00000001 (NEEDED) Shared library: [libQtCore.so.4]
- The argument parsing -A option does not support the ARM hard-fp ABI. If the first arguments for a function or a method call are the floating points, bogus values are shown for them.
- The latrace tool still misses some features (such as extracting information from struct pointer args on return). These limitations prevent you from using the tool, for example, for checking file descriptor creation and deletion matches.
Limitations
- The LD_AUDIT-based tracing used in latrace misses function and C++ method calls that do not go through PLT, such as QObject::deleteLater calls through QObject::qt_metacall.
Note: The GDB and functracer tools do not have these limitations regarding the -a option.
Further information
For more information on the tools, see the following links: