


Using strace
The strace tool shows how an application interacts with the operating system, and how it uses the system calls or a subset of them. It displays the used system calls and their parameters. It also shows the return codes of the system calls. In addition, strace can be attached to an already running process (-p <pid>). The strace can also timestamp each syscall for approximate profiling.
Use strace to find out the following:
- Why does the program fail to start or exits early?
- Which (configuration) files are used by the program?
- Is the program idle or wasting battery unnecessarily?
- Where did a frozen program become unresponsive?
- How does an application communicate with the network?
Packages
source: strace
binary: strace
Installing strace on the Harmattan device
Install strace through the developer mode applet.
Prerequisite: Developer mode must be enabled.
- Select Settings > Security > Developer mode.
- Install the Tracing bundle package by clicking Install.
- You get a notification screen that lists all the applications to be installed in the bundle package. To install, click OK.
- A dependency notice appears. Click Accept.
For more information on developer mode and installable tools, see Activating developer mode.
Using the tool with the Instrumentation Dashboard
Instrumentation Dashboard is an extension to Qt Creator that provides data gathering and visualisation features.
Precondition:
Instrumentation Dashboard has been installed and connected to the Harmattan device. For instructions, see Using Instrumentation Dashboard.
The strace user interface contains the following views:
- Dump view: The Dump view displays the terminal output.
- Summary view: The Summary view displays processed output (output from the Dump view is processed). The following information is displayed:
- Name of the system call
- Number of calls made to the system call
- Total time processor spent in the system call
- Minimum and maximum time the processor spent in this system call
- Line number in strace dumped output that resulted in minimum processor time
- Line number in strace dumped output that resulted in maximum processor time
- Time sample view: The Time sample view provides a visual representation of count of read, write and I/O system calls over a period of time. The data is processed based on the Dump view output.
- Size sample view: The Size sample view provides a visual representation of the number of bytes read during read system call and number of bytes written during write system call over a period of time. The data is processed based on the Dump view output.
The views may be selectively viewed by selecting or deselecting them from the Chart Selector button.
Settings in the Instrumentation Dashboard
To invoke the settings window, click the strace Settings icon ![]() in the tool bar.
in the tool bar.
- -c -- count time, calls, and errors for each syscall and report summary
- -f -- follow forks, -ff -- with output into separate files
- -F -- attempt to follow vforks, -h -- print help message
- -i -- print instruction pointer at time of syscall
- -q -- suppress messages about attaching, detaching, etc.
- -r -- print relative timestamp, -t -- absolute timestamp, -tt -- with usecs
- -f -- follow forks, -ff -- with output into separate files
- -T -- print time spent in each syscall, -V -- print version
- -v -- verbose mode: print unabbreviated argv, stat, termio(s), etc. args
- -x -- print non-ascii strings in hex, -xx -- print all strings in hex
- -a column -- alignment COLUMN for printing syscall results (default 40)
- -e expr -- a qualifying expression: option=[!]all or option=[!]val1[,val2]...
- -o file -- send trace output to FILE instead of stderr
- -O overhead -- set overhead for tracing syscalls to OVERHEAD usecs
- -s strsize -- limit length of print strings to STRSIZE chars (default 32)
- -S sortby -- sort syscall counts by: time, calls, name, nothing (default time)
Using the strace visualisation
To get the strace data in a visual format, follow these steps:
- Click Tools in the Instrumentation Dashboard top menu bar and select strace.
- Select Select Target App in tool bar. The Target Application Selector window opens.
-
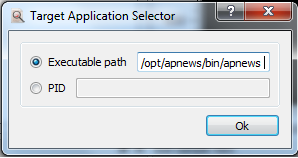 Select target application
-
- Enter the Executable path, for example /opt/apnews/bin/apnews and click OK.
- Click Start on the tool bar. This launches the AP Mobile application on the device and starts updating the Dump View, Summary View, Time Sample View and Size Sample View in the Intrumentation Dashboard window.
-
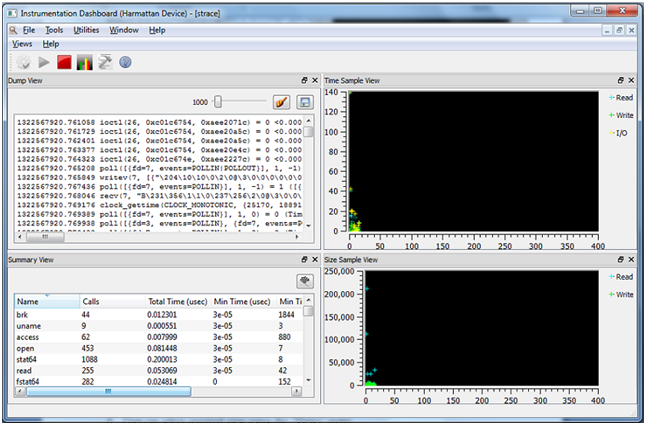 strace window
-
- After the required data is collected, click Stop.
Use the different views to analyse the aquired data. You can select the required view using the Views menu at any time.
The following table presents the button elements in the example figure.
| Element in the example figure | Description |
|---|---|
|
|
Opens the Target Application Selector window. The icon is disabled if an application is running. |
|
|
Start icon launches the application on Harmattan device and starts collection of application profiling data. The icon is disabled until a target application is selected or when an application is already running. |
|
|
Stop icon stops the collecting of application profiling data and stops updating the visualisations. |
|
|
Settings button launches the strace settings window. |
|
|
Help button launches the tool help. |
Using the tool on the Harmattan device
You can run the following examples in the Harmattan device.
Tracing system calls within an application
The following example illustrates how to generate a simple list of system calls made by the application by running strace with the program path as a parameter.
$ strace -f ls
execve("/bin/ls", ["ls"], [/* 15 vars */]) = 0
brk(0)                                  = 0x70000
uname({sys="Linux", node="RM680", ...}) = 0
access("/etc/ld.so.preload", R_OK)      = -1 ENOENT (No such file or directory)
open("/etc/ld.so.cache", O_RDONLY)      = 3
fstat64(3, {st_mode=S_IFREG|0644, st_size=69545, ...}) = 0
mmap2(NULL, 69545, PROT_READ, MAP_PRIVATE, 3, 0) = 0x3aad3000
close(3)                                = 0
open("/lib/libc.so.6", O_RDONLY)        = 3
read(3, "\177ELF\1\1\1\0\0\0\0\0\0\0\0\0\3\0(\0\1\0\0\0\234V\1\0004\0\0\0"..., 512) = 512
fstat64(3, {st_mode=S_IFREG|0755, st_size=1320436, ...}) = 0
mmap2(NULL, 1357076, PROT_READ|PROT_EXEC, MAP_PRIVATE|MAP_DENYWRITE, 3, 0) = 0x3aae4000
mprotect(0x3ac22000, 32768, PROT_NONE)  = 0
mmap2(0x3ac2a000, 12288, PROT_READ|PROT_WRITE, MAP_PRIVATE|MAP_FIXED|MAP_DENYWRITE, 3, 0x13e) = 0x3ac2a000
mmap2(0x3ac2d000, 9492, PROT_READ|PROT_WRITE, MAP_PRIVATE|MAP_FIXED|MAP_ANONYMOUS, -1, 0) = 0x3ac2d000
close(3)                                = 0
mmap2(NULL, 4096, PROT_READ|PROT_WRITE, MAP_PRIVATE|MAP_ANONYMOUS, -1, 0) = 0x3aac9000
set_tls(0x3aac97d0, 0x3aac9ea7, 0xc5536160, 0x3aac97d0, 0x3aad2000) = 0
mprotect(0x3ac2a000, 8192, PROT_READ)   = 0
mprotect(0x3aad1000, 4096, PROT_READ)   = 0
munmap(0x3aad3000, 69545)               = 0
getuid32()                              = 0
gettimeofday({1293943486, 152648}, NULL) = 0
ioctl(0, TIOCGWINSZ, {ws_row=24, ws_col=80, ws_xpixel=0, ws_ypixel=0}) = 0
ioctl(1, SNDCTL_TMR_TIMEBASE or TCGETS, {B38400 opost isig icanon echo ...}) = 0
stat64(".", {st_mode=S_IFDIR|0755, st_size=4096, ...}) = 0
brk(0)                                  = 0x70000
brk(0x91000)                            = 0x91000
open(".", O_RDONLY|O_NONBLOCK|O_LARGEFILE|O_DIRECTORY|O_CLOEXEC) = 3
fcntl64(3, F_GETFD)                     = 0x1 (flags FD_CLOEXEC)
getdents64(3, /* 11 entries */, 32768)  = 336
getdents64(3, /* 0 entries */, 32768)   = 0
close(3)                                = 0
exit_group(0)                           = ?
Essentially, one line in the output refers to one system call made to the Linux kernel. Every line has the name of the system call, the parameters to the call, and finally the return value of the system call.
For example, the following line shows that the system call that was called from ls was open() with parameters ("/etc/ld.so.cache", O_RDONLY) and it succeeded with the return value of 3 (a file descriptor):
open("/etc/ld.so.cache", O_RDONLY) = 3
Note: Failed system calls usually (not always) return a return code of -1.
The following example illustrates a failed access() call:
access("/etc/ld.so.preload", R_OK) = -1 ENOENT (No such file or directory)
In the above example, the access() return value of -1 is displayed together with the symbolic name of ENOENT error code. This means that the file does not exist.
The first calls in the strace output are from the dynamic linker loading the program library dependencies and setting up the memory mappings for them.
The -f option tells strace to track all threads of a given process. Even though ls does not have any, this is the recommended practice.
Note: Do not use -f option with strace if the program forks additional processes and you do not want to trace them.
Attaching to a running process with strace
You can use strace to attach to a running process. This is especially helpful when you are debugging a daemon type of an application. The strace tool shows which system calls the daemon is calling without restarting the daemon.
The following example shows how to start the top program on the device and leave it running in one terminal. After this, you can open another terminal and attach strace to the top program.
1. To start the top program on the Harmattan device, enter the following command:
$ top

## the screen clears and top starts to loop...

Mem: 409744K used, 81760K free, 0K shrd, 5148K buff, 112048K cached
CPU:  1.3% usr  0.9% sys  0.0% nic 97.6% idle  0.0% io  0.0% irq  0.0% sirq
Load average: 0.00 0.02 0.00 1/310 4714
  PID  PPID USER     STAT   VSZ %VSZ %CPU COMMAND
 4714  4702 root     R     2152  0.4  0.9 top
  778     1 user     S     127m 26.5  0.7 /usr/bin/sysuid
...
2. Start another terminal window and enter the following command:
strace -f -p $(pidof top)
The -f option tells strace to track all the given process threads. Even though top does not have any, this is the recommended practice. You can attach the -p flag strace to a running process.
The pidof command tells the process ID (PID) of a running program. The PID depends on the workstation. The following example shows the output of strace when PID is 4714.
Process 4714 attached - interrupt to quit
restart_syscall(<... resuming interrupted call ...>) = 0
ioctl(1, TIOCGWINSZ, {ws_row=24, ws_col=80, ws_xpixel=0, ws_ypixel=0}) = 0
open("/proc", O_RDONLY|O_NONBLOCK|O_LARGEFILE|O_DIRECTORY|O_CLOEXEC) = 3
getdents64(3, /* 244 entries */, 32768) = 6184
stat64("/proc/1/", {st_mode=S_IFDIR|0555, st_size=0, ...}) = 0
open("/proc/1/stat", O_RDONLY|O_LARGEFILE) = 4
read(4, "1 (init) S 0 1 1 0 -1 4194560 24"..., 1023) = 195
close(4)                                = 0
stat64("/proc/2/", {st_mode=S_IFDIR|0555, st_size=0, ...}) = 0
open("/proc/2/stat", O_RDONLY|O_LARGEFILE) = 4
read(4, "2 (kthreadd) S 0 0 0 0 -1 214961"..., 1023) = 135
close(4)

... long list of output ...
In the output, you can see which system calls the top program is calling during its main loop. In this case, top is opening a lot of files under the /proc/ file system to obtain information about the running processes in the system.
Tracing all running applications
You can also trace several applications that run on the device. For example, you can use strace to find out which process accesses a specific file but does not keep it open all the time. If it is kept open all the time, you can find it in /proc/*/fd/ or with lsof.
The following example illustrates how to trace the open() system calls from all running programs started after the Xorg process.
strace -e trace=open \
      $(cd /proc/; first=$(pidof Xorg|cut -d' ' -f1); \
      for pid in [0-9]*; do \
         if [ $pid -gt $first ] && [ $pid != $$ ]; then \
             echo "-p $pid"; \
         fi; \
      done)
Note: Do not trace all processes started early in the boot. If you accidentally suspend certain processes that hardware or software watchdogs are monitoring, the device can be rebooted.
The following output is displayed:
# strace -e trace=open \
>       $(cd /proc/; first=$(pidof Xorg|cut -d' ' -f1); \
>       for pid in [0-9]*; do \
>          if [ $pid -gt $first ] && [ $pid != $$ ]; then \
>              echo "-p $pid"; \
>          fi; \
>       done)
Process 1069 attached - interrupt to quit
Process 1082 attached - interrupt to quit
...snip...
Process 663 attached - interrupt to quit
attach: ptrace(PTRACE_ATTACH, ...): Operation not permitted
attach: ptrace(PTRACE_ATTACH, ...): Operation not permitted
Process 689 attached - interrupt to quit
...snip...
[pid   553] open("/sys/class/leds/lp5523:channel0/device/engine3_mode", O_WRONLY|O_CREAT|O_TRUNC, 0666 <unfinished ...>
[pid   644] open("/dev/ak89740", O_RDONLY <unfinished ...>
[pid   553] <... open resumed> )        = 21
[pid   793] open("/dev/input/gpio-keys", O_RDONLY) = 23
... etc ...
The output shows which processes strace attaches to and which files are opened by the processes. If strace attaches to multiple threads or processes, it adds the PID of the process before each output line.
Note: If the processes make a lot of system calls, strace may not show all of them, and the output is only indicative. For more detailed information, trace a specific single process.
Monitoring multiple system calls
To trace multiple system calls, use the -e option. For example, instead of -e trace=open, enter the following command:
-e trace=open,close,pipe2
Note: If you also want to trace new processes created by the traced processes, give the -f argument.
Adding timestamps to an application
To add timestamps into your program, do the following:
#define profile_mark(s) access("MARK: " s, F_OK)
...
profile_mark("here we call gtk_init()");
You can then track these and use, for example, fork and exec for additional processes. Enter the following command:
strace -ttt -f -e process,access -o strace.log my-program
To obtain more detailed information on the activities the application carried out between the marks you added, use latrace.
Using other strace options
The following strace options are also useful:
-f: tells strace to also trace the given process threads and any other processes it forks. By default, strace does not do this.-e expr: limits the scope of the output.- The following example only includes network-related calls in the output:
- strace -e network wget meego.com
- The following example only shows the system calls related to accessing files:
- strace -e file ls
-tt: adds the time when the system call was made before each call. You can use this for initial performance analysis.- Note: The timestamps given by strace can be inaccurate because strace itself needs to do system calls to determine the timings.
- The following example shows how to trace all the given process IPC and network-related system calls and timestamp for each traced system call:
- strace -tt -e trace=ipc,network ./some_program -programs -own -args
Further information
For more information on the tool, see the following links: