


Using Energy Profiler
Energy Profiler is used to monitor power consumption, cumulative energy consumption, CPU processing activities, memory use, and network IP traffic activities on your Harmattan device. Based on the information produced by the tool, you can identify and improve the application use cases that consume excessive amounts of power or other resources - allowing you to provide software that performs optimally on Harmattan devices and delivers a great user experience.
To associate power consumption events with application activity, you can take screenshots as part of the profile data. You can use Energy Profiler to view your results on the device or export them as a CSV, PNG, or SVG file for analysis on your workstation.
Packages
binary: energy-profiler
Measurement data views
The Energy Profiler data views are provided by the installed measurement plug-ins. The following table presents the plug-ins and data views that are available by default:
Note: The power plug-in is always enabled. The other installed plug-ins are enabled by default but can also be disabled, if necessary.
| Plug-in | Data view | Description | Example view |
|---|---|---|---|
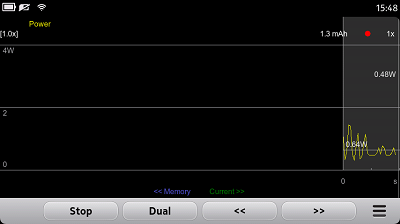
| Power plug-in | Power (default view) | Shows power consumption over a measurement period. |
|
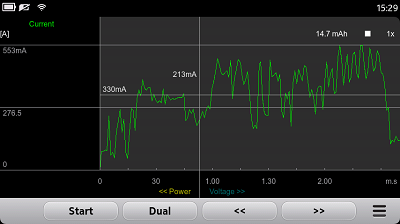
| Current | Shows current consumption, which is the measured current draw from the battery. As the battery discharges, voltage drops and current increases so that power consumption stays roughly constant. Current consumption for the same use case varies according to battery-charge level. |
|
|
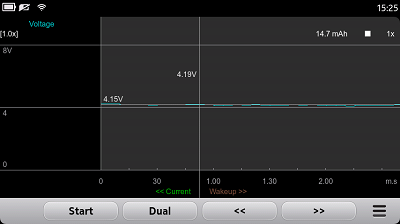
| Voltage | Shows the battery-voltage levels. As the battery discharges, its voltage level decreases from roughly 4.2 V to 3 V until the device switches itself off. |
|
|
| Processor plug-in | CPU load | Shows main processor CPU load percentage. Dynamic CPU frequency changes are taken into account in the measured values, which is why the highest reported value (100 per cent) is only achieved when the CPU frequency is the highest possible. For this reason the measured CPU load percentage may be different compared to those reported by other tools. |
|
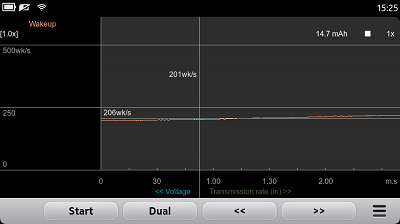
| Wake-up plug-in | Wake-up | Shows how often the CPU is woken up from sleep state. |
|
| Memory plug-in | Memory | Shows the amount of used RAM and swap. In this view, one megabyte (MB) is 10242 = 1048576 bytes. |
|
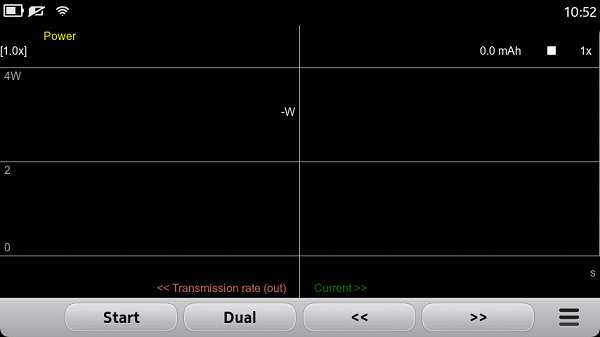
| Network traffic plug-in | Transmission rate (in or out) | Shows the IP (Internet Protocol) packet transmission rate in either kB/s or packets/s (shown in separate views). The monitored network interfaces are GPRS and WLAN. In this view, one kilobyte (kB) is 1000 bytes. |
|
User interface elements and layout
The following figure illustrates the displayed elements in the Energy Profiler user interface in the power view (shown by default).
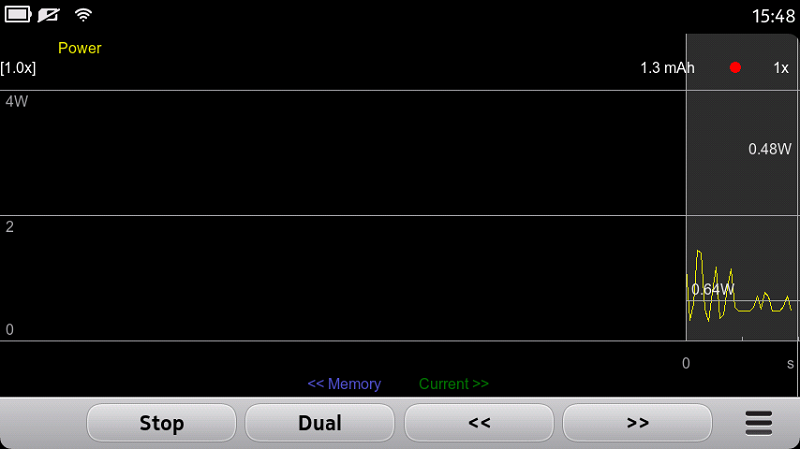
The following table presents the elements shown in the example figure.
| Element in the example figure | Description |
|---|---|
|
|
Displayed data view. |
|
|
Energy indicator: shows the total energy consumed in milli-Ampere-hour (mAh). The value is shown for the area between two markers. |
|
|
Measurement state: A red circle shows that measurement is started. A white square indicates that measurement is stopped. |
|
|
Zoom level for the time axis. |
|
|
Measurement unit for the time axis. |
|
|
Previous and next data views. |
|
|
Buttons for switching to previous and next data views. |
 |
Application Menu button: when you tap the button the available menu options are displayed. |
|
|
Dual button. If you tap the button, two views are overlaid and the text changes to Single. |
|
|
Stop button. If you tap the button, tracing is stopped and the text changes to Start. |
|
|
Zoom level for the value axis. |
| x axis (grey horizontal line) | Time axis. |
| y axis (grey vertical line) | Value axis. If Vertical Instant Value Line has been enabled, you can see the exact measurement value next to the vertical line when measurement has been stopped. For examples, see Energy Profiler plug-ins and data views table. |
Background colours
The state of the backlight is indicated in the views as follows:
- Very faint grey background colour indicates that the backlight is on.
- Black background colour indicates that the backlight is off.
Blue background colour indicates that the charger is connected.
Available options in Application Menu
The following table presents the options available in the Application Menu.
| Option | Description | State in which visible |
|---|---|---|
| Reset Zoom | Reverts the view to default state if the graph's value axis has been zoomed in or out. | Always |
| Auto Zoom/Manual Zoom | Auto Zoom: Automatically scales the graph's value axis to fit the measurement data on the display.
Manual Zoom: Disables Auto Zoom. |
Always |
| Save | Saves measurement data on the device in the EnergyProfiler directory of the user's home folder. |
When measurement is stopped (and data is available). |
| Load | Accesses the saved measurement data in the EnergyProfiler directory of the user's home folder. Note: The loaded data replaces the current measurement data. |
When measurement is stopped. |
| Export | Exports the saved measurement data to SVG, PNG, or CSV format and saves the data on the device in the EnergyProfiler directory of the user's home folder. |
When measurement is stopped (and data is available). |
| Settings | The following settings are available:
|
When measurement is stopped. |
| Statistics | Shows statistics for the displayed measurement data. | When measurement is stopped (and data is available). |
| Start htop | Provides access to the htop tool for further analysis of the current system state. | Always |
| Clear | Clears the displayed measurement data. | When measurement is stopped (and data is available). |
| Help | Shows the help documentation of the Energy Profiler tool. | Always |
Installing Energy Profiler on the Harmattan device
Install Energy Profiler through the developer mode applet.
Prerequisite: Developer mode must be enabled.
- Select Settings > Security > Developer mode.
- Install the Power analysis bundle package by clicking Install.
- You get a notification screen that lists all the applications to be installed in the bundle package. To install, click OK.
- A dependency notice appears. Click Accept.
For more information on developer mode and installable tools, see Activating developer mode.
Using the tool
When an application is launched, you can run Energy Profiler in the background to analyse its power consumption. When the measurement has been stopped, you can zoom in or out of the view with a pinch gesture. You can also scroll the view on the device by dragging it horizontally or vertically.
Note: If the charger is connected, the power and current measurement values can be negative.
Getting started
To launch Energy Profiler, tap the following icon.
The following view is displayed.
Starting and stopping measurement
To start the measurement, tap the Start button on the toolbar.
The button changes to Stop, and Energy Profiler starts to create a graph. By default, the tool displays measured power consumption. To display other views, tap << or >>.
To stop the measurement, tap the Stop button on the toolbar.
Switching between measurement views
To switch between views:
- Tap << or >> on the toolbar until you reach the required measurement view.
Switching between dual and single views
You can view the measurement data in one of the following:
- single view mode (one of the available measurement views is displayed on the screen)
- in dual view mode (two views are displayed simultaneously on the screen)
To switch to dual view:
1. To select the first view displayed by Energy Profiler, tap << or >> on the toolbar until you reach the required view.
2. To select the second view displayed by Energy Profiler, tap Dual and tap << or >> on the toolbar until you reach the required view.
The following figure illustrates how the dual view is displayed by Energy Profiler. In the example figure, power consumption is shown with a yellow line and CPU load with a purple line.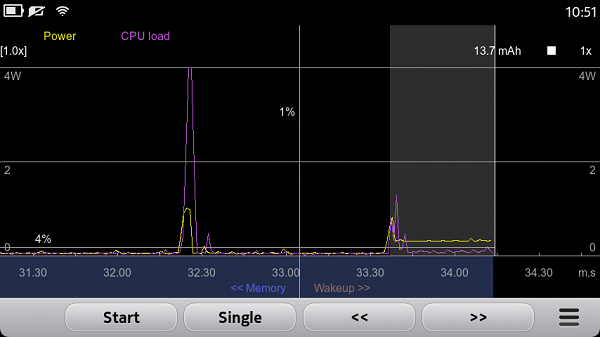
To switch back to the single view, tap Single on the toolbar.
Managing measurement data
Exporting measurement data
Energy Profiler stores the measurement in .jce format used by the Energy Profiler on Symbian devices.
To export the data into other formats:
1. Select Application Menu button > Export.
2. Tap Choose data type and select one of the following:
- SVG: Creates an SVG drawing for the currently displayed view containing all the measurement data.
- PNG: Creates a screenshot of the current view.
- CSV: Creates a Microsoft Excel compatible CSV text file containing all the measurement data.
Energy Profiler stores its data to the EnergyProfiler directory of the user's home folder.
Note: Energy Profiler has an emergency save feature, which saves the data from the current measurement if the battery runs out or the device is switched off. The data can be recovered the next time the application is started.
Saving measurement data
To save measurement data on the device in .jce format:
- Tap Application Menu button > Save and name the file.
The .jce measurement data files are saved in the EnergyProfiler directory of the user's home folder.
Accessing stored measurement data
To access measurement data that has been stored on the device:
1. Tap Application Menu button > Load.
2. Select the required measurement data file, and tap the Load button from the toolbar.
The .jce measurement data files in the EnergyProfiler directory of the user's home folder are displayed.
Clearing measurement data
To clear the displayed measurement data, tap Application Menu button > Clear.
Taking screenshots of the application UI
Screenshots show the topmost application and its current content, which can help you analyse energy consumption. When you have switched on the feature, Energy Profiler creates a screenshot of the user interface according to the selected mode.
To switch on the screenshot feature, tap Application Menu button > Settings > Screenshots and select Trigger. You can then select one of the following modes:
- Periodic: Energy Profiler takes a screenshot at defined intervals.
- Automatic: Energy Profiler takes a screenshot when the power consumption rises suddenly.
To switch off the screenshot feature, tap Application Menu button > Settings and select Off mode for Screenshots.
When you have taken a screenshot, a vertical red line is drawn at that position in the measurement.
To view the screenshot, tap the line. The screenshot is shown at the top of the screen.
Modifying screenshot settings
To modify the screenshot settings, tap Application Menu button > Settings > Screenshots:
- Interval: You can select the interval for taking screenshots when periodic mode has been selected.
- Sound: You can switch on or off a sound that indicates when Energy Profiler has taken a screenshot.
Analysing applications with the htop tool
Energy Profiler provides easy access to htop for further analysis of individual applications.
To start htop:
- Tap Application menu button > Start htop. For more information on the tool, see Using htop.
Hints and tips
Keep the following information in mind when using the Energy Profiler:
- You can configure the sampling period for the tool as 0.25, 1, or 5 seconds. To minimise overhead from measurement activity in long stand-by cases, select 5 seconds as the sampling period.
- Do not keep unnecessary applications running during testing. Applications in the background may affect the measurements, because the Energy Profiler measures total power consumption.
- Do not keep the device’s charger connected during measurements to avoid getting erroneous results.
- For best practices on reducing power consumption, see Optimising power consumption.
- To access the Energy Profiler help file, tap Application Menu button > Help.